


< Previous | Contents | Manuals Home | Boris FX | Next >
Graph Editor Reference
The graph editor can be launched from the Graphs room ![]() on the main toolbar, the Window/Graph Editor menu item, or the F7 key. It can also appear as a viewport in a layout. The graph editor contains many buttons; they have extensive tooltips to help you identify the function and features.
on the main toolbar, the Window/Graph Editor menu item, or the F7 key. It can also appear as a viewport in a layout. The graph editor contains many buttons; they have extensive tooltips to help you identify the function and features.
All graph editors share a single clipboard for key data, so you can move keys from one channel to another, object to another, or one editor to another. The clipboard can be modified from Sizzle scripts to achieve special effects.
The graph editor has two major modes, graphs and tracks, as these examples
show:
Tracks Mode:
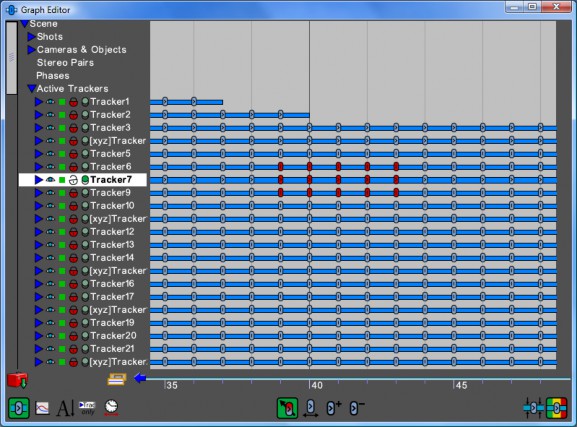
Tracker 7 is unlocked and selected in the main user interface, and a selection of keys from trackers 6, 7, and 9 are selected in the graph editor. While the other trackers are automatic, #1,2,3 and 7 are now supervised and track in the forward direction (note the directionality in the key markers). The current frame # is off to the left, before frame 35.
Graphs Mode:
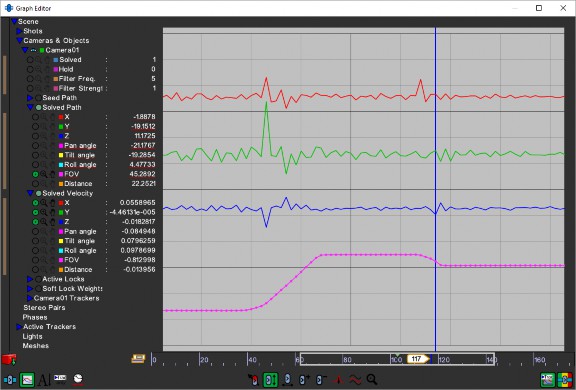
The capture shows a graph display of Camera01. The red, green, and blue traces are solved camera X,Y, and Z velocities, though you would have to expose the solved velocity node if you did not know. The magenta trace with key marks every frame is a field-of-view curve from a zoom shot. The time area is in scroll mode, the graph shows frames 62 to 143, and we are on frame 117.
Hint . This panel does a lot of different stuff. If you only read this, you will probably not understand exactly what or why everything does what it does. We could go on and on trying to describing everything exactly, to no purpose. Keep alert for what SynthEyes can do, and give it a try inside SynthEyes—you will understand a lot better.
©2026 Boris FX, Inc. — UNOFFICIAL — Converted from original PDF.